Skip to content
VividMaps

  • Atlases
  • Map Posters
  • Scratch Maps
  • Globes
  • Videos
Political maps
April 1, 2016 Alex

University of Virginia’s Center for Politics Electoral College Projection: Clinton 347, Trump 191

Via www.centerforpolitics.org

Read more: University of Virginia’s Center for Politics Electoral College Projection: Clinton 347, Trump 191 →

Political mapsVivid maps
April 1, 2016 Alex

Percent who say they have a favorable view of the U.S. minus percent unfavorable

Read more: Percent who say they have a favorable view of the U.S. minus percent unfavorable →
EnergyEnvironment maps
April 1, 2016 Alex

When will rooftop solar be cheaper than the grid?

Read more: When will rooftop solar be cheaper than the grid? →
Ethnic mapsForestsHeat mapsHistorical MapsInternet
April 1, 2016 Alex

Map of the races of Europe (1919)

Read more: Map of the races of Europe (1919) →
Economic mapsInteractive mapsMapping Stereotypes
March 31, 2016 Alex

Property Prices Index 2016

Property is that which belongs to or with something, whether as an attribute or as a component of said thing.property

Read more: Property Prices Index 2016 →
Animated mapsRiversSatellite images
March 31, 2016 Alex

Changing river path seen through satellite images

Sedimentary geologist Zoltan Sylvester downloaded Landsat data using Earth Explorer and strung together images of the Ucayali River (Peru) to

Read more: Changing river path seen through satellite images →
Culinary
March 31, 2016 Alex

A Food and Wine Map of Italy: What Each Region Brings to the Table

From Piedmont’s truffles to Sicily’s bold flavors, each Italian region offers unique dishes and wines. Explore Italy’s diverse culinary landscape through this detailed regional guide.

Read more: A Food and Wine Map of Italy: What Each Region Brings to the Table →
Environment maps
March 31, 2016 Alex

Light pollution in UK

The Dark Sky represented by the darkest shade of blue. Related posts:  – Light pollution in Europe: 1992 vs. 2010

Read more: Light pollution in UK →
Interactive mapsReal estate
March 30, 2016 Alex

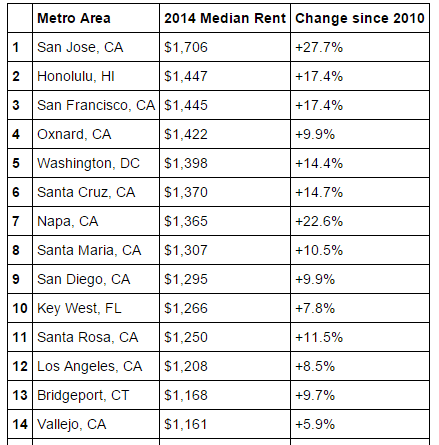
The Landscape of US Rents

U.S. metro areas with the highest median rent U.S. metros with the greatest rent increase U.S. metro areas with the

Read more: The Landscape of US Rents →
World
March 30, 2016 Alex

This map shows which countries are being taken over by robots

Japan was number one with 310,508 operational robots, according to data from 2012. There’s even a hotel staffed almost entirely

Read more: This map shows which countries are being taken over by robots →
Cultural cartographyMapping StereotypesScienceWorld
March 30, 2016 Alex

Ages of Consent

Read more: Ages of Consent →
Cities
March 29, 2016 Alex

Map of countries whose capital is not their largest city

Read more: Map of countries whose capital is not their largest city →
Climate ChangeInteractive mapsNews
March 29, 2016 Alex

The News Co-occurrence Globe

An interactive visualization of how countries are mentioned together in the world’s news media. This data visualization captures the inherent

Read more: The News Co-occurrence Globe →
Page 317 of 521« First«...313314315316317318319320321...»Last »

Trending now

  • Steel production in 1800 mapped
    220 Years of Steel Production, Mapped From 1800 to 2025Oct 18, 2026
  • Best Value Mobile Data World Map
    Maps reveal what countries have the most affordable mobile dataAug 9, 2021
  • Stereotypes about the United States
    The stereotype map of every US StateOct 29, 2015

Related Products

  • Push pin maps
  • Globe drinks cabinets
  • Maps of the United States
  • Board games
  • Monopoly
  • Map-based strategy board games
  • History Board Games
  • Coloring Books
  • Handheld GPS
  • GPS Watches
  • GPS Trackers

Vivid Maps Tools

  • Convert Latitude/Longitude
  • Elevation Finder
  • Distance Calculator
  • Kilometers to Miles Distance & Length Converter
  • Weight Converter
  • Volume Converter
  • Daylight Comparison
  • Time Zone Converter
  • Antipodes Map
  • Find cities with a similar climate
  • Find cities with a similar climate (2050)
  • How hot cities could be in 2050
  • The U.S. Population Lines

Stay connected

Get the latest maps, insights and updates delivered to your inbox.

Unsubscribe anytime.

VividMaps

Maps that explain the world.

Beautiful, data-rich maps to help you understand our world — its people, places and connections.

Explore

World map World atlas Map posters Globes

Company

About Privacy Contact

Stay connected

Follow us for the latest maps, insights and updates.

Independent WebsiteVirusScanner trust report for vividmaps.com
© 2026 Vivid Maps. All rights reserved.
A more connected world