Interactive swell map
VentuSky visualized the movement of waves in the world’s oceans and seas. Related post: – Wind, Rain and Temperature Interactive Maps
Read more: Interactive swell map
VentuSky visualized the movement of waves in the world’s oceans and seas. Related post: – Wind, Rain and Temperature Interactive Maps
Read more: Interactive swell map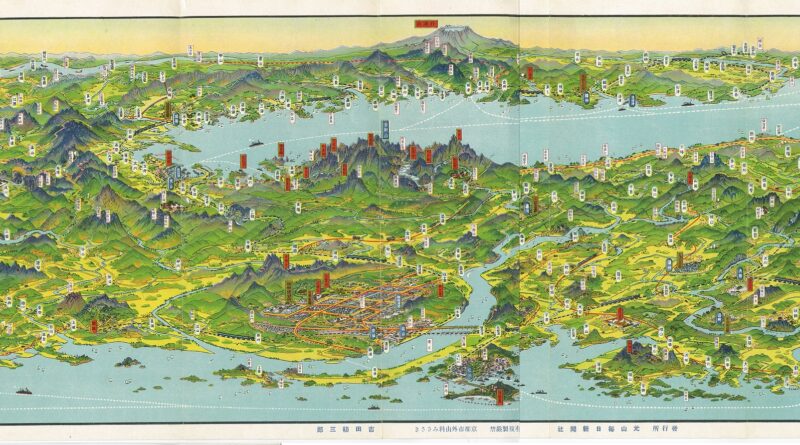
In 1929, Yoshida Hatsusaburō drew a vast panoramic view of colonial Korea. It stretched from Qingdao to Osaka, showed every railway on the peninsula, and was published by a newspaper in Wonsan to coincide with an exhibition celebrating nearly two decades of Japanese rule.
Read more: Yoshida’s 1929 Bird’s Eye View of KoreaThis map was prepared by the Royal Australian Survey Corps in the 1950s.
Read more: Australia and Europe comparative map (1950)“Map showing the distribution of the slave population of the Southern States of the United States. Compiled from the Census
Read more: Slave population of the southern states of the U.S.While Hillary Clinton got about 2.9 million more votes general, a margin of 2.1 percent of the total cast, Donald Trump conquered supremacy in the Electoral College, winning 30 U.S. states with 306 pledged electors out of 538, and reversed the permanent swing states of Florida, Ohio, and Iowa, as well as the “blue wall” of Michigan, Wisconsin, and Pennsylvania, which had been Democratic citadels in presidential elections since the 1990s.
Read more: 2016 U.S. presidential election mappedRelated post: – United States Old Maps
Read more: Wealth in the U.S. (1872)Related posts: – Urban Scratchoff – Interactive map of New York City in year 1609 – Map of Manhattan by
Read more: Coast Survey Nautical Chart of Map of New York City & Harbor (1866)“Government degree of civilization and number of inhabitants.”
Read more: Moral And Political Chart Of The World (1827)